
Sample report
See what a full monthly cycle looks like.
An example for an illustrative distributor with about US$15M in annual revenue: the report for the month and the documents for the three weeks that follow.
Illustrative case, not a client.
11-minute video
One month, step by step.
Read the video text
Illustrative case. The accountant closes March. Revenue beats budget; gross profit barely moves. Revenue: $1.28M, 6.0% above budget. Gross profit: $402K, only $2K above. Where did the growth go?
Week 1, report. The report shows what happened. Gross profit from budget to actual: volume +$31K, price +$13K, discounts −$34K, mix −$4K, unit cost −$4K; net change +$2K. The direction is set right there. The how is worked out in weeks 2 to 4: deep dive, options and focus.
Week 2, deep dive. The detail shows where. Four accounts in industrial supplies bought $309K at list price, 36% above plan, with a 13.7% discount and a 22.2% gross margin. All other accounts: a 4.0% discount and a 30.1% margin. Four accounts hold almost all of the excess discount. They bought more and left less profit.
Week 3, options. Three options, and what each is worth. 1. A 6% discount ceiling, with approval above it: +$24K a month if volume holds, +$11K if 15% of the four accounts’ volume is lost. 2. Raise the line’s list prices by 2%: +$12K a month, better than today as long as the line loses less than 7% of its volume. 3. Shift the mix toward higher-margin lines: about +$12K for every $100K of sales that move. And what it risks: the ceiling stays better than today as long as less than 28% of those accounts’ volume is lost.
Week 4, focus. One decision, one owner, and how it is measured. Discount rate on the line: 8.6% in March, target 4.9% or less, alert above 6%. Discount rate on the four accounts: 13.7%, target 6% or less, alert on any order above the ceiling without approval. Sales at list price, four accounts: $309K, target $263K or more; below $221K the decision is reviewed. Gross profit of the line: $157K, target $168K to $181K, alert below $157K. Next month’s report opens with these four measures.
And the following month: this month it was discounts. Next month it may be cash, inventory or one customer.
Finanzap. This, every month, with your numbers. Financial planning and analysis for business owners.
1 minute · no sound · illustrative data · easier to read in full screen
New to Finanzap? First, watch the 1-minute video on what we do.
2The story in this example
Revenue beat budget. Gross profit barely moved.
Gross profit: budget to actual
March, US$ thousands. Change vs. budget by driver.
13-week cash forecast
Projected cash at the end of each week, US$ thousands.
3How to read the report
The reasoning you are buying, with the first page as an example.

What the numbers show
Revenue is 6.0% above budget and gross profit only $2K above it. Gross margin fell from 33.2% to 31.5%. Volume added $31K and price $13K; discounts took back $34K.
Why it matters
The extra volume was bought with discounts. Commissions and freight follow volume, not margin, so the month closes below plan in a month when sales beat the plan.
The question it opens
Is growth creating more gross profit, or only more revenue?
What management could do
Set a discount ceiling on Industrial supplies (MRO), where the discount went from 4.0% to 8.6%. Ask which customers received it and what was obtained in return. Check next month whether volume holds.
4Try it with your numbers
How much more do you have to sell to pay for a discount?
Move the two sliders. This is the easy part of the question.
Illustrative calculation. Nothing you move here is sent or stored.
+20% more volume to earn the same
For every 10 units you sell today, you need to sell 12.
A 5% discount takes 17% of the gross profit on every sale.
They do not fit in the picture: more than 30 units for every 10.
What you sell today What you still have to sell
Anyone can run this sum. What we deliver is what comes next: which customers the discount sits in, what was obtained in exchange, and what to decide. See that analysis in the example
Open this calculator on its own page
Try the cash weeks calculator
5What the example contains
The report for the month and the documents for each week.
One cycle, every month
Step 1 · Report
The monthly review: summary, profitability, cash and priorities.
It opens the cycle. It says what changed, why, and what deserves management’s attention.
-
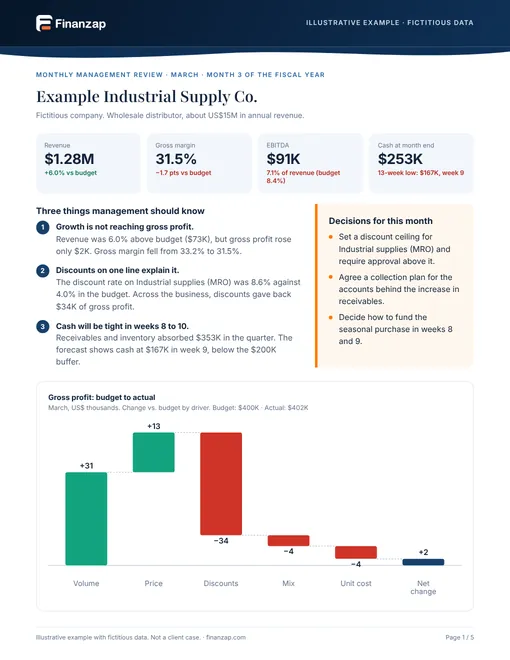
Answers: how did the month go, and what should management know?
Executive summary
The month in four numbers and three things management should know.
-
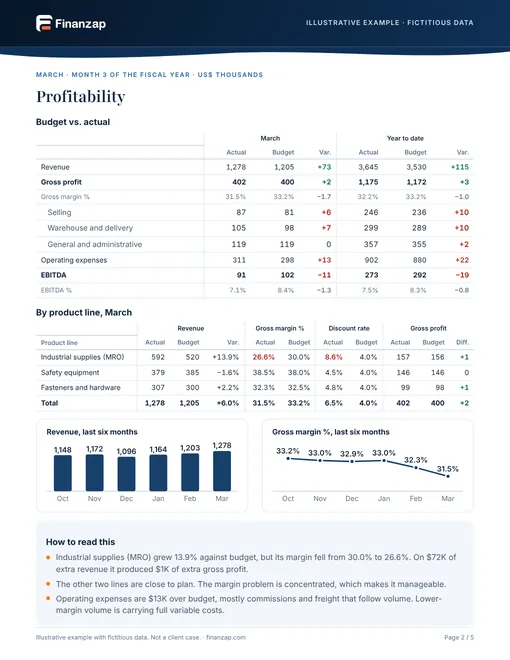
Answers: where did profit come from, and where did it go?
Profitability
Budget vs. actual, the margin bridge and results by product line.
-
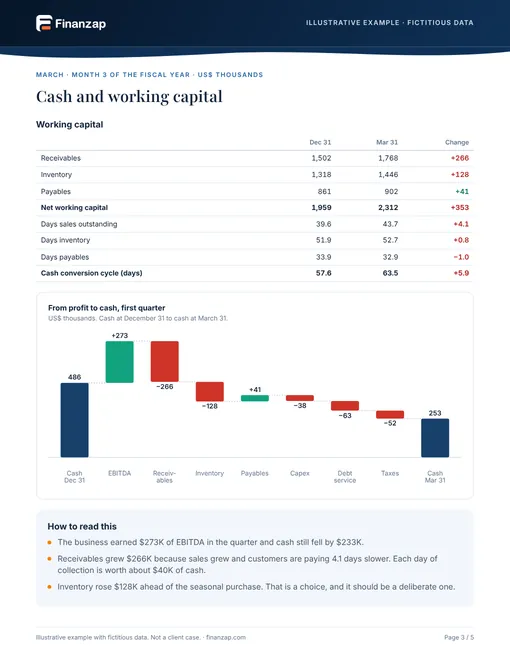
Answers: why did cash not follow profit?
Cash and working capital
Receivables, inventory, payables, and the bridge from profit to cash.
-
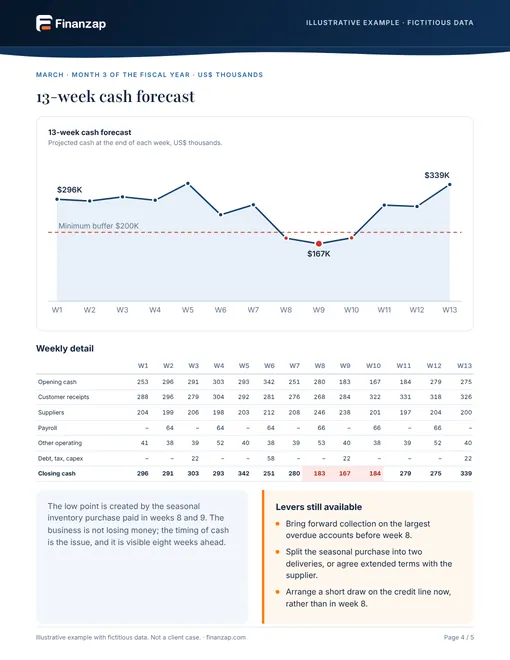
Answers: when does cash get tight, and is there time to act?
13-week cash forecast
When cash gets tight and what can still be done.
-
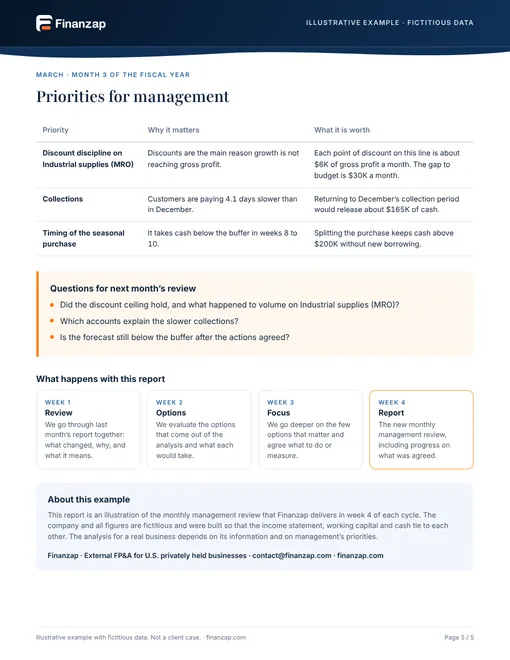
Answers: what deserves attention first, and what is it worth?
Priorities
What deserves attention, with an estimate of what each item is worth.
Download the monthly report (PDF)
Steps 2 to 4 · One conversation a week
From direction to a concrete plan.
Each conversation has its own, shorter document on the subject the report left open.
-
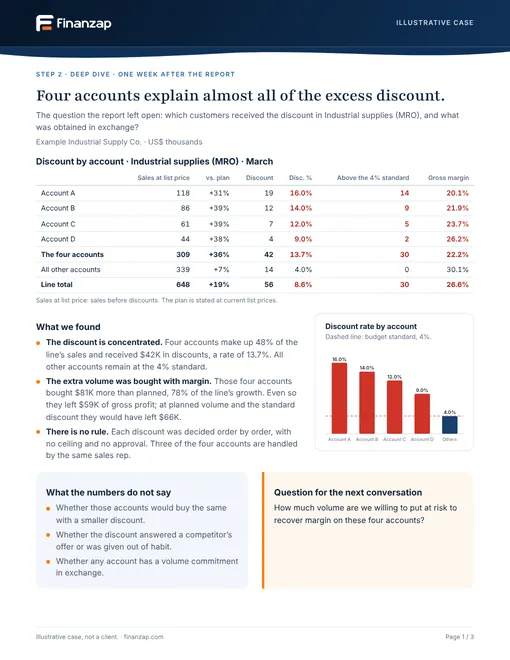
Step 2 · Deep dive
Answers: who is behind the problem?
Four accounts explain almost all of the excess discount.
The detail by customer: four accounts make up 48% of the line’s sales and practically all of the discount above standard. They bought $81K more than planned and left less gross profit.
-
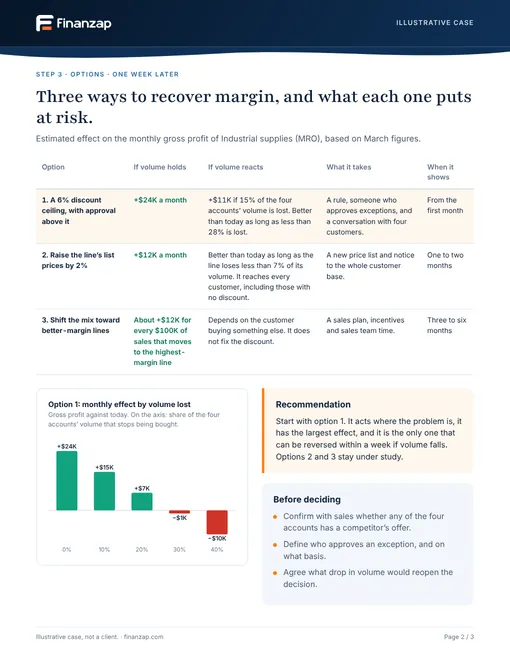
Step 3 · Options
Answers: what can we do, and what does each option put at risk?
Three ways to recover margin, and what each one puts at risk.
A discount ceiling is worth about $24K a month if volume holds, and stays better than today as long as no more than 28% of those accounts’ volume is lost.
-
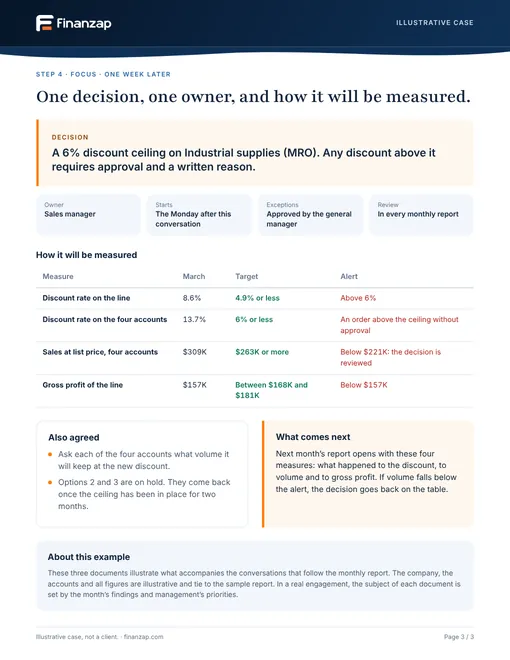
Step 4 · Focus
Answers: what do we decide, who owns it, and how do we measure it?
One decision, one owner, and how it will be measured.
A 6% ceiling with approval above it. Four measures, each with a target and an alert, that open next month’s report.
Download the documents for the three weeks (PDF)
The exact analysis depends on the business. The structure and the level of reasoning are what stay the same.
6Next step
Want this for your own numbers?
Start with the financial question you are trying to answer.
A 20-minute conversation: we understand your context, answer your questions and tell you whether the service fits. No financial information needed.