
Sample report
See what a monthly management review looks like.
A five-page example for a fictitious distributor with about US$15M in annual revenue. It is the deliverable of week 4 of every cycle.
Illustrative example with fictitious data. Not a client case.
The story in this example
Revenue beat budget. Gross profit barely moved.
In the example month, revenue is ahead of plan and management feels good about it. The review shows why the extra sales did not reach gross profit, and what is about to happen to cash.
- Revenue
- $1.28M
- +6.0% vs budget
- Gross margin
- 31.5%
- −1.7 pts vs budget
- EBITDA
- $91K
- 7.1% of revenue (budget 8.4%)
- Cash at month end
- $253K
- 13-week low: $167K, week 9
Gross profit: budget to actual
March, US$ thousands. Change vs. budget by driver.
13-week cash forecast
Projected cash at the end of each week, US$ thousands.
What is inside
Five pages. One conversation with management.
-
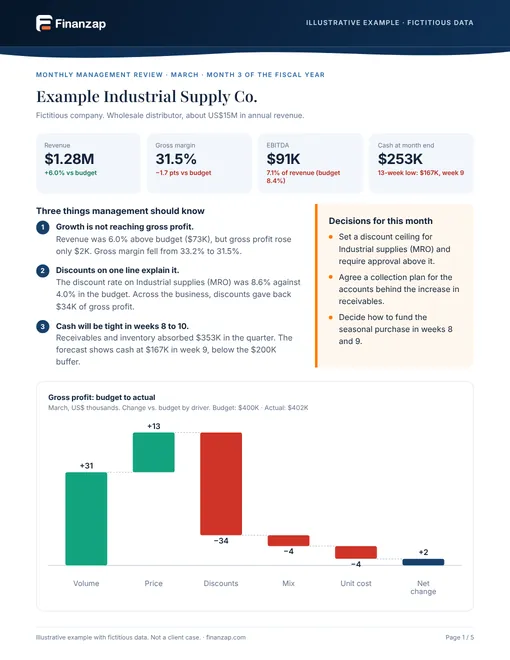
Executive summary
The month in four numbers and three things management should know.
-
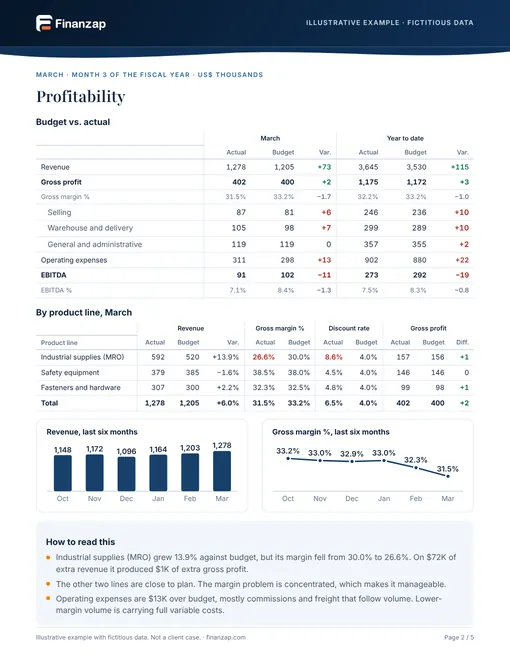
Profitability
Budget vs. actual, the margin bridge and results by product line.
-
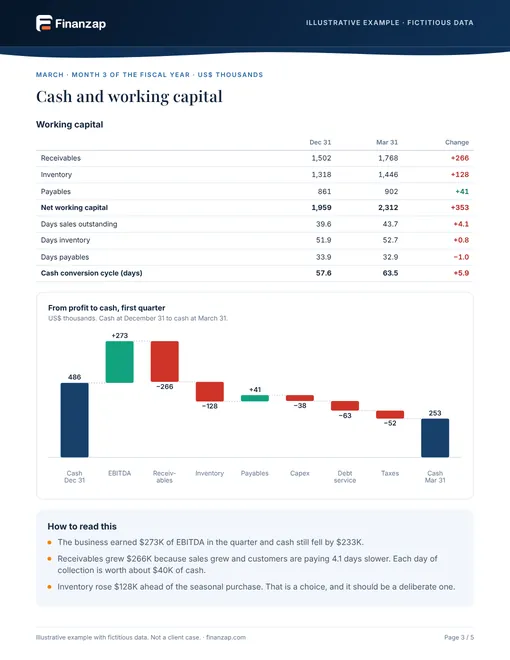
Cash and working capital
Receivables, inventory, payables, and the bridge from profit to cash.
-
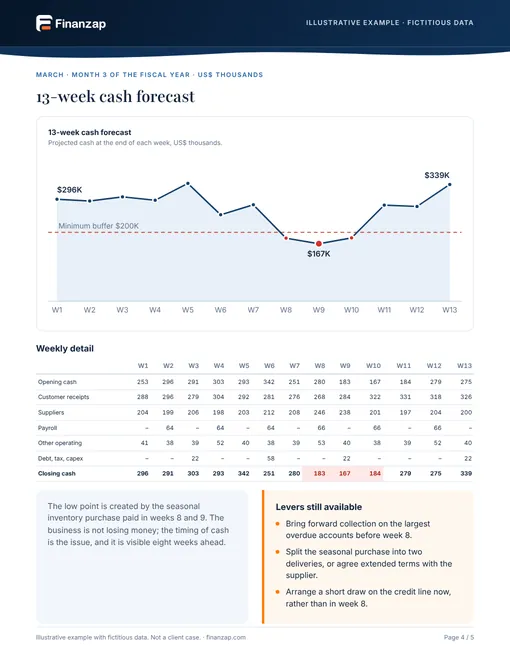
13-week cash forecast
When cash gets tight and which levers are still available.
-
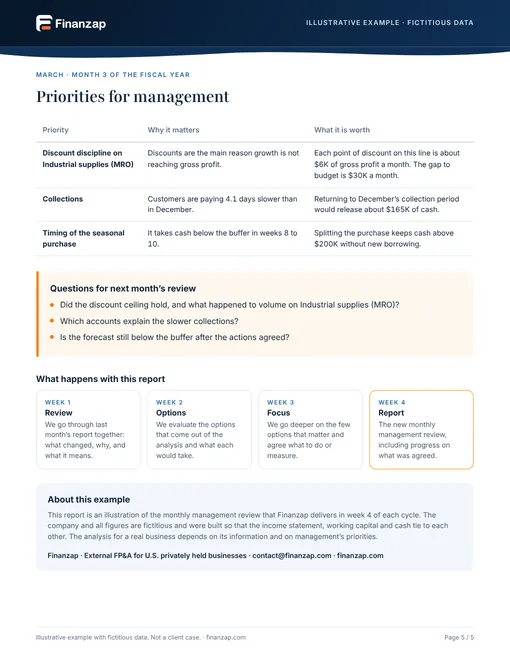
Priorities
What deserves attention, with an estimate of what each item is worth.
The exact analysis depends on the business. The structure and the level of reasoning are what stay the same.
Want this for your own numbers?
Start with the financial question you are trying to answer.
A short first conversation. No special report or presentation required.